

By David Enna, Tipswatch.com
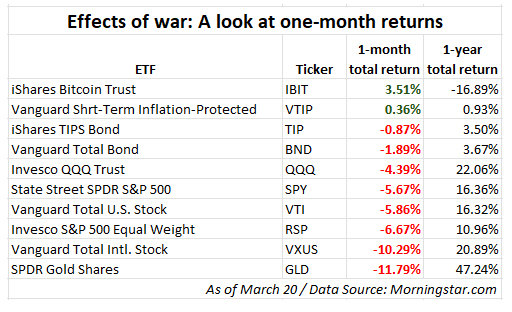
I realize that the fixed rate of the U.S. Series I Savings Bond isn’t top of mind for many investors at the moment, given an active war in the Mideast, soaring gas prices, and sharp declines in both the stock and bond markets. But in our little inflation-watching community, it’s a big deal.
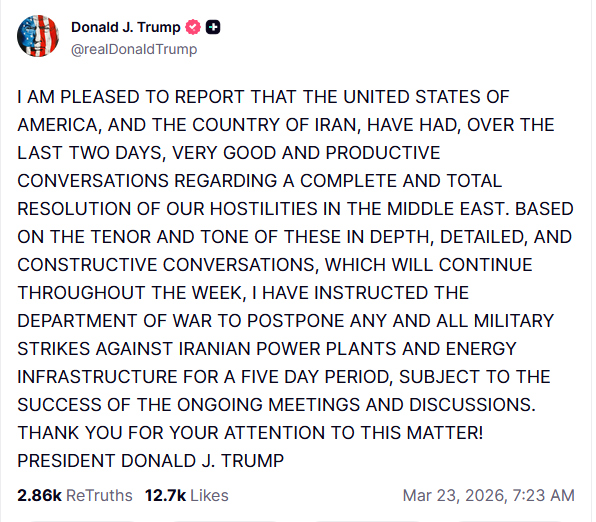
Both the I Bond’s permanent fixed rate and inflation-adjusted variable rate will be reset May 1 for purchases from May to October 2026. Before the outbreak of war on Feb. 28 it appeared likely the I Bond’s fixed rate would fall from the current 0.90% to 0.80%. And it also seemed likely the composite rate would fall well below the current 4.03% because of a decline in the variable rate.
The fixed rate is important because it is permanent for the potential 30-year life of the I Bond. It represents the I Bond’s “real yield” above inflation. March’s surge in both prices and interest rates has changed the likely result of the May 1 reset.
(For more on the basics of I Bonds and potential buying strategies, read my Jan. 25 article: “I Bond buying guide for 2026: Wait it out.”)
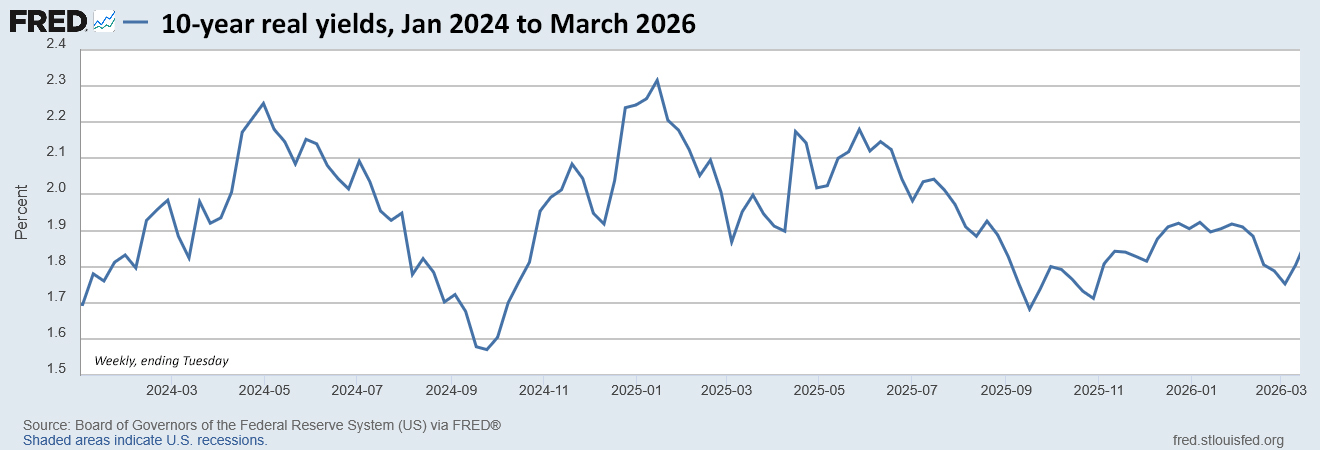
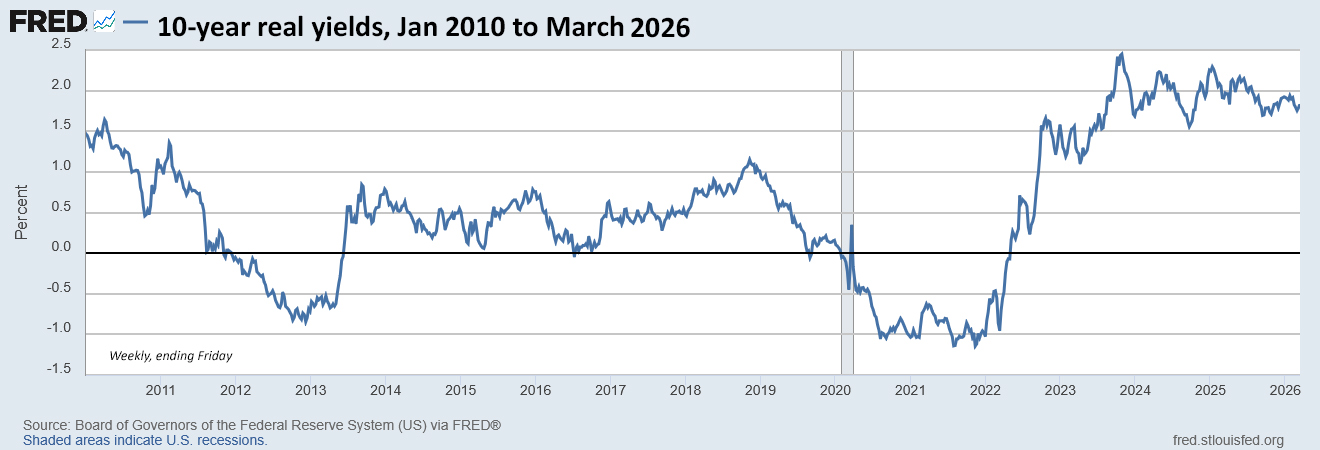
Although the U.S. Treasury does not reveal its formula for determining the I Bond’s fixed rate, we know Treasury tracks trends in real yields and adjusts accordingly. This forecasting formula has worked for the last decade: Take the average real yield of the 5-year TIPS over the preceding six months and apply a ratio of 0.65.
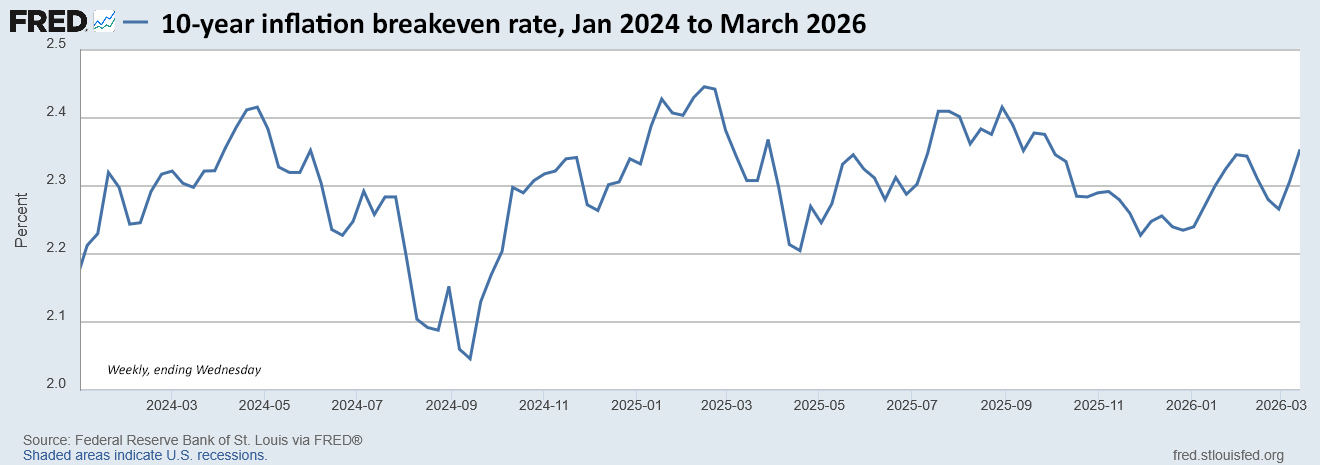
The next rate reset will come May 1, so we are interested in real yields from November 2025 to April 2026.
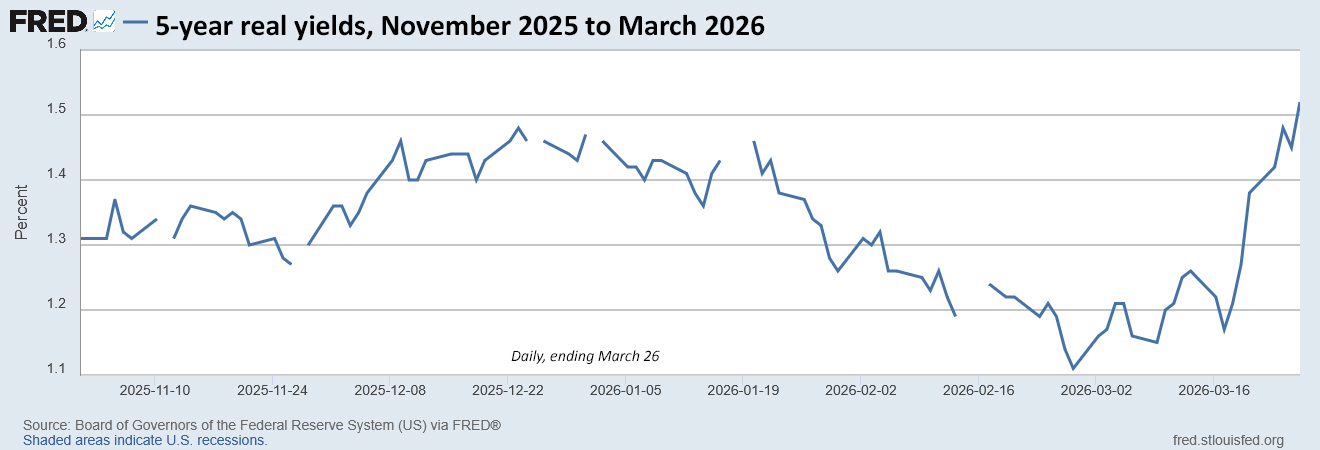
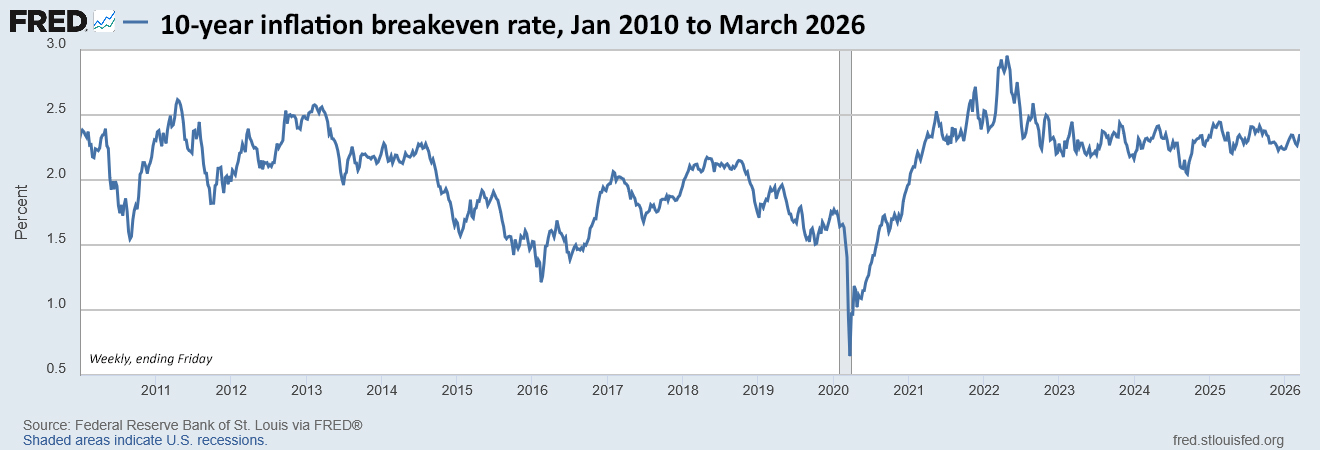
The before. On Feb. 27, one day before hostilities broke out, the 5-year real yield had fallen to 1.11% and looked likely to continue in a range below 1.20%, which would have dropped the I Bond’s fixed rate to 0.80% at the May 1 reset.
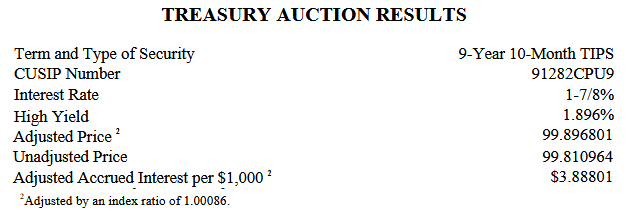
The after. At Friday’s close, the Treasury was estimating the 5-year real yield at 1.50%, up 39 basis points for the month, so far. The current trend — it appears — would have the 5-year real yield solidly above 1.30% in April.
Let’s look at how the equation has changed.
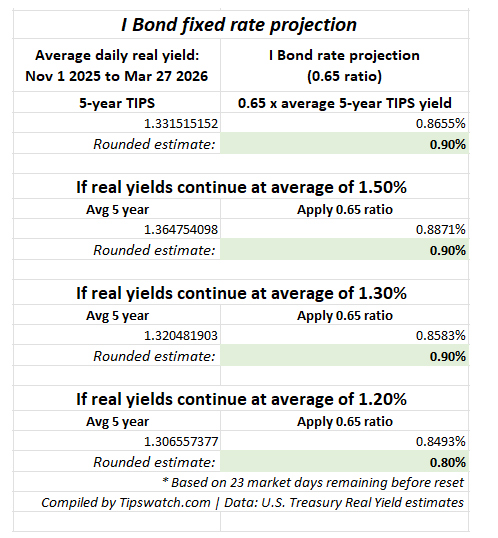
In this chart, the projection is calculated using a 0.65 ratio of the average daily 5-year real yield from November 1, 2025, to March 27, 2026. Using that data, the real yield average is 1.33% and results in an I Bond projection of 0.90%.
1.331515152 x 0.65 = 0.8655%. The I Bond’s fixed rate is always rounded to the tenth decimal point, so the current projection is 0.90%.
That projection holds even if the 5-year real yield drops to the 1.30% range for the 23 remaining market days until the May 1 reset. It would take a fall to an average of 1.20% for those 23 days to cause the projection to fall to 0.80%. That kind of fall is unlikely, even if the Iran hostilities are resolved quickly.
It is even more unlikely that the I Bond’s fixed rate will rise above the current 0.90%, which would require a massive move higher in real yields to balance off five months of accumulated data.
Conclusion. It looks highly likely that the I Bond’s fixed rate will hold at 0.90%.
Qualifications
This projection is based on 10 years of Treasury history in setting the I Bond’s fixed rate. But the Treasury could change course at any time and we should be aware of that. President Trump’s first-term Treasury followed the formula and has continued to do so in his second term.
What about the variable rate?
The March inflation report will be issued April 10 at 8:30 a.m. and we will get the final piece needed to know the I Bond’s inflation-adjusted variable rate, which will roll into effect for all I Bonds ever issued, depending on the original month of purchase.
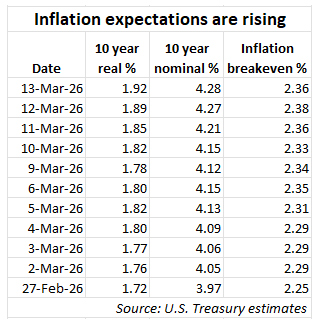
Here are the data so far:
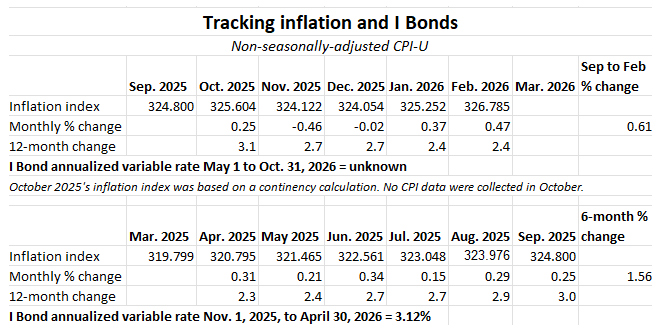
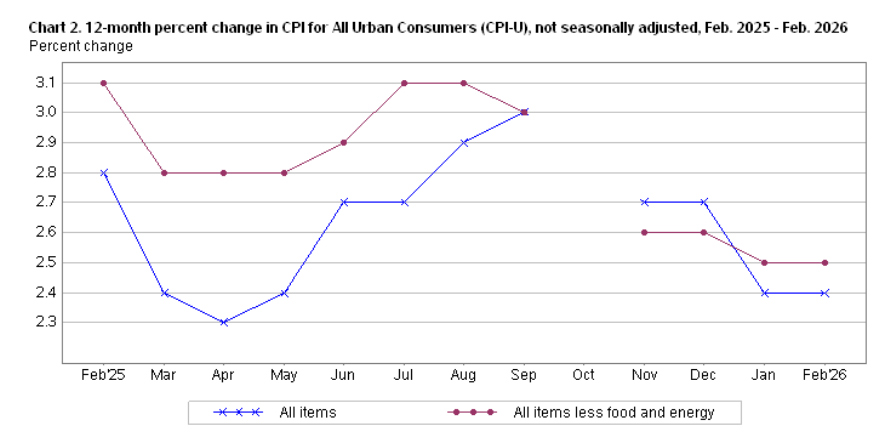
At the end of February — if we assumed moderate inflation in March — we were looking at a potential variable rate of about 2%, well below the current 3.12%.
But soaring gas prices in March — up nearly 40% for the month — are likely to trigger a dramatically higher non-seasonally adjusted inflation rate for that month. The Cleveland Fed’s Nowcasting page is projecting a rate of 0.76% for all-items inflation in March. That is a seasonally adjusted number, so the actual non-seasonally adjusted number for March could be 1.0% or higher.
Conclusion. If we get 1.0% non-seasonally adjusted inflation in March, the variable rate would soar to 3.22% and we would be looking at a composite rate of about 4.2% for six months for purchases from May to October 2026.
Is there a strategy?
Yes. The strategy remains the same as I wrote in January: “Wait it out.” We will get the March inflation number on April 10 and then we will have more than two weeks to contemplate purchasing I Bonds in April, in May, later in the year, or not at all.
If the I Bond’s fixed rate looks likely to hold at 0.9%, and the composite rate will be competitive with the current 4.03%, there will be less incentive to buy I Bonds in April. And in fact, the logical path might be to see how rates develop before the November 1 reset.
An I Bond earns the then-current composite rate for six full months before transitioning to a new variable rate. So a purchase late in May would be financially equivalent to a purchase late in October.
Although real yields are climbing (and could remain elevated) I Bonds remain an attractive inflation-adjusted investment, earning tax-deferred interest, exempt from state income taxes, and with rock-solid deflation protection.
April is going to be an interesting month. I will have more to say on this topic after we see that March inflation report.
• Confused by I Bonds? Read my Q&A on I Bonds
• Let’s ‘try’ to clarify how an I Bond’s interest is calculated
• Inflation and I Bonds: Track the variable rate changes
• I Bonds: Here’s a simple way to track current value
• I Bond Manifesto: How this investment can work as an emergency fund
—————————
Donate? This site is free and I plan to keep it that way. Some readers have suggested having a way to contribute. I would welcome donations. Any amount, or skip it, your choice. This is completely optional.
—————————
Follow Tipswatch on X for updates on daily Treasury auctions and real yield trends (when I am not traveling).
Feel free to post comments or questions below. If it is your first-ever comment, it will have to wait for moderation. After that, your comments will automatically appear. Please stay on topic and avoid political tirades. NOTE: Comment threads can only be three responses deep. If you see that you cannot respond, create a new comment and reference the topic.
David Enna is a financial journalist, not a financial adviser. He is not selling or profiting from any investment discussed. I Bonds and TIPS are not “get rich” investments; they are best used for capital preservation and inflation protection. They can be purchased through the Treasury or other providers without fees, commissions or carrying charges. Please do your own research before investing.


I believe you asked 'what is your money earning now?' and I answered... I'm earning a lot more real yield…